Money & Megatrends
November 21, 2025
By Brian Hunt
Inside today’s issue:
- This is no time for investors to panic
- Our plan for trading a Mag 7 leader with big upside potential
- Put this sector on your radar. It’s setting up for a bounce
- Biotechnology and health care stocks continue their tremendous relative strength
Stock Market Investors: This Is No Time to Panic
On October 28, the benchmark S&P 500 reached an all-time closing high of 6,890.89. At the time, investors were maximum bullish on AI, and they believed interest rate cuts were on the way that would further juice the stock market.
Since then, investor sentiment has swung in the other direction. The S&P 500 dropped 5.8%. High-growth, high-volatility sectors, such as semiconductors, space, robotics, and nuclear tech, are down more than 10%. Some high-profile growth stocks, such as Coinbase (COIN), Robinhood (HOOD), and Rocket Lab (RKLB), are down more than 25%. Bitcoin has plummeted. Investor panic is in the air.
This is a good time to step back and keep the “long view” in mind: the glacier-like, multi-year, tectonic movements of business cycles and stock markets. Let’s think about the whole book and not just one chapter.
Below is a 3.5 year chart of the S&P 500. You can see the broad market bottomed in late 2022 and began climbing higher in early 2023. This rally took the S&P from 4,100 to around 6,900.
You can also see that the S&P 500 could fall to 6,200 and still be well within the confines of its multi-year uptrend. This would be an additional drop of 5.3% from its current level of around 6,550. It would send high-growth, high-volatility sectors down another 10% – 25%.
I’m not saying a decline of this magnitude will happen, only that it could happen. Although it would generate sheer panic among millions of people, a decline of this size would not bump the market out of its long-term, primary trend.
Stocks are the top-performing asset class of the past 100 years. But the price you pay for that superior long-term performance is volatility. That includes enduring tough times like the past three weeks.
I doubt a selloff down to 6,200 is in the cards. I believe we are near the bottom of what will prove to be a short-term correction.
But regular readers know by now that I think forecasts like that are the most overrated things in finance. For traders, minding price action and getting on the right side of trends is far more important than anybody’s forecast.
If you’re a long-term investor who owns passive index funds, none of this concerns you. You’re investing in the overall market for the long haul. But traders can keep the 6,200 area in mind. We can go all the way down there and still be within the confines of a primary uptrend. This is no time to panic.
The S&P could fall to 6,200 and still be in a bull market

The Homebuilding Sector Is Setting Up for a Rebound

Of all the sectors that have struggled recently, few have suffered more than homebuilders. The big homebuilder fund, the iShares U.S. Home Construction ETF (ITB), is down 19.5% since early September.
This weakness should set up a good trade soon.
Since early 2023, homebuilder stocks have experienced rising prices, mirroring the broader market averages. But persistently high interest rates have sent investors fleeing from the sector. This has left ITB in a deeply oversold state… one that is often followed by a relief rebound.
One of the world’s most reliable stock trading strategies is to buy a stock, sector, or index that has suffered a selloff inside a long-term uptrend. This puts a powerful long-term uptrend in your favor and increases the likelihood that the trade starts off as a winner with a quick rebound.
We could see that setup in the homebuilding sector. Plus, Trump & Friends could give it a boost.
Home affordability has become an important issue in U.S. politics. A large percentage of young voters believe they can’t afford a home.
It’s not just in their heads. Home affordability metrics are at all-time extremes, to the negative side. Trump & Friends know this trend could cost them elections, so it’s likely they will make significant efforts to improve the situation, which would be positive for homebuilders.
That’s the bull case. Regular readers know that’s a heck of a lot less important than what the market thinks of the bull case. If ITB can stop falling and catch its breath in the mid-$90s per share range, it should set up a good trade in homebuilders. I’ll keep you posted on this potential trade.
Homebuilders are deeply oversold and due for a rebound

Our Plan for Trading a Mag 7 Leader With Big Upside Potential

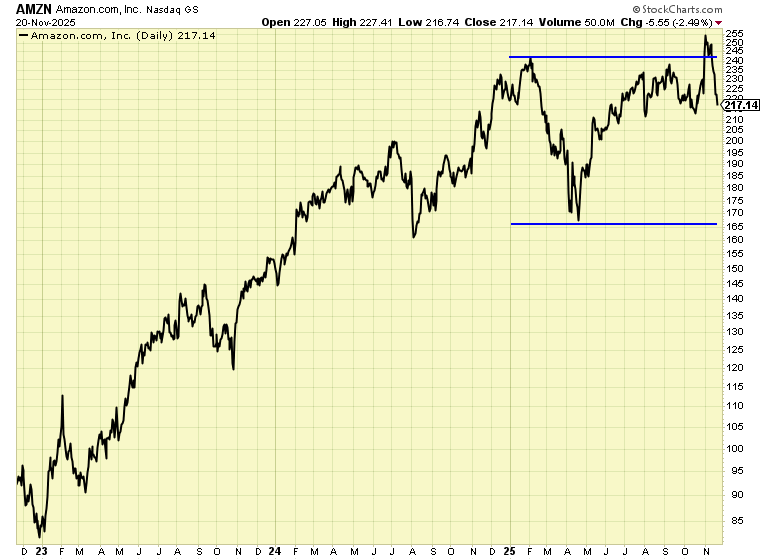
After a lot of moving up and down over the past month, Amazon is back into its “box” with nothing to show for it.
Online retail and cloud computing giant Amazon (AMZN) is a favorite stock among institutional growth investors. The company has big competitive advantages and strong growth. Plus, it stands to benefit from the AI + Robotics revolution, which should make its logistics chain cheaper and more efficient.
These fundamental drivers haven’t helped Amazon much recently. The stock is trading at the same level it was 11 months ago. This allows us to apply Nicolas Darvas-style “box” analysis to the stock and create a trading plan…
Nicolas Darvas was a great trader of the 1950s. He wrote the wonderful book How I Made $2 Million in the Stock Market, published in 1960. Darvas made a fortune by trading leading growth stocks. He looked for companies with strong growth potential whose shares were trading in sideways consolidation patterns.
Darvas called this sideways trading pattern a “box.” You could draw the top and bottom of the box on a chart to see it.
When a stock was trading inside a box, Darvas would avoid it. The stock had no momentum behind it. When it broke out of the box to the upside, he would buy it and look to ride the upward swing.
If the stock continued its upward trajectory, he would hold the position. If the stock dipped and went back into the box, Darvas would sell it.
Make more on the winners than you lose on the losers. Rinse and repeat and make a lot of money.
This simple but powerful strategy – focused on making a lot when you’re right and losing a little when you’re wrong – made Darvas millions of dollars in the 1950s… back when $2 million was a lot of money.
As you can see in the three-year chart below, Amazon recently broke out of its sideways “box.” However, the broad market selloff helped send shares back into the box.
Given Amazon’s strong growth outlook, I suggest keeping an eye on it here and apply the Darvas box trading system. If shares can break out soon, it’s a bet worth taking.
Amazon goes back into its box
Market Notes
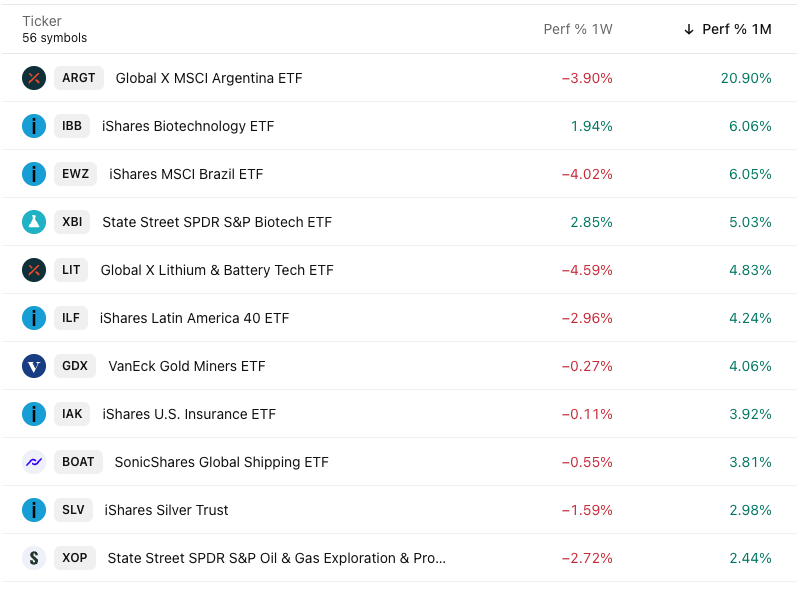
- The biotechnology bull market continues. The SPDR Biotech ETF (XBI) and the iShares Biotechnology ETF (IBB) reached 1-year highs this week. XBI is up 29% since our bullish August note.
- Health care giants Eli Lilly (LLY), J&J (JNJ), Medtronic (MDT), Gilead (GILD), and Natera (NTRA) reached new highs this week. This shows the health care theme is booming. It’s extraordinary relative strength in a weak overall market environment.
- The high-profile “Bitcoin play” Strategy (MSTR) reached a new 1-year low today. Shares are down 48% over the past three months.
- Tech supergiant Google (GOOG) reached a new all-time high today. The company is emerging as the leading horse in the “AI applications” race.
The Trend Leaderboard
Top performing ETFs over the past month